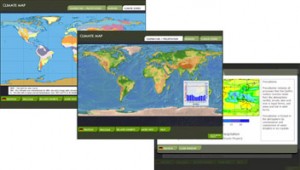
Exhibit: Climate Data Map
Venue: Phaeno Science Centre
Location: Wolfsburg, Germany
Date: Opening 2005
Client: Ansel Associates
Contributors: Mystus, Ansel Associates
Client Requirements / Visitor Experience:This exhibit uses just such a database of historical weather information. Visitors are able to move the cursor over the on-screen globe and see the 10 year seasonal average for temperature and precipitation at any grid point on a one degree grid covering the globe. The visitor can zoom in and see how shorelines, mountains or other physical features affect the temperature or precipitation. The visitor may also view a map which explains the various climate zones around the world.
Mystus Expertise: Incorporating a database of information on precipitation and temperature into a graphically pleasing and comprehensible exhibit.
Unique Features: The graph that follows the cursor and constantly updates it self based on the location of the cursor on the map, even when zoomed in several times.
*Project Challenges: Dealing with a large amount of data but still creating an exhibit that reacts quickly.

